Back to home2025
Mapping invasive acacias from above
A YOLOv8 segmentation model that outlines invasive acacia in satellite imagery, trained on a dataset we built from Portugal’s land-use map.
- Who it’s for
- Forest managers who need to know where acacia is spreading without surveying every hillside on foot.
- What it changed
- Turned a public land-use map into a labelled training set within hours, and a satellite tile into a map of where to look. First place at JunctionX Lisbon 2025.
- Where
- JunctionX Lisbon 2025
- Outcome
- Winner, first place overall
- My part
- Full backend, and the computer vision and ML side
- Team
- Three people, “The Three Musketeers”
- Built with
- YOLOv8-seg, Ultralytics, GeoPandas, rasterio, Hugging Face, FastAPI, Celery, Redis, Docker, AWS S3, Firebase, React
Find acacias in an aerial image
This runs our fine-tuned YOLOv8 segmentation model in your browser with ONNX Runtime, so nothing is uploaded anywhere. Pick a tile from the validation set or use your own top-down image. The first run downloads about 27 MB: the model plus the runtime.
Validation tiles
Tiles: Esri World Imagery (Maxar, Earthstar Geographics), cut along the COS2018 land-use map.
Pick a tile to run the model.
Model card
- Model
- YOLOv8n-seg (3.4 million parameters), fine-tuned for 15 epochs at 640 px. Exported to ONNX, 13 MB.
- Trained on
- Satellite tiles cut around acacia stands in Portugal’s COS2018 land-use map (class 5.1.1.6), plus tiles of other land as negatives. Masks are the map’s polygons, rasterised.
- Score
- 0.56 box mAP@50 and 0.24 mask mAP@50 on the validation split. Flags 22 of 32 acacia tiles and 0 of 16 negatives.
- Runs
- In your browser with ONNX Runtime Web (WebAssembly). Images never leave your device.
Meant for A first pass that points foresters at places worth checking. It is tuned to stay quiet when unsure, so a blank result means “nothing obvious”, not “no acacia here”.
Where it fails
It misses about a third of the stands
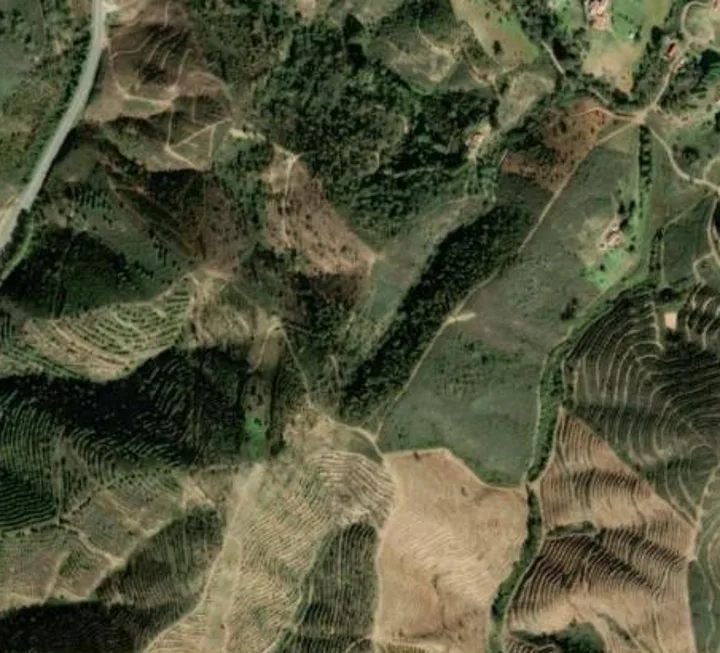
In this validation tile, COS2018 maps an acacia stand, and much of it looks to be in yellow bloom. The model flags nothing at the default threshold. Our guess is that most training tiles show the trees out of flower. Drop the threshold to 0.15 and it does find the stand, so the signal is there but weak.
The outlines are blobs
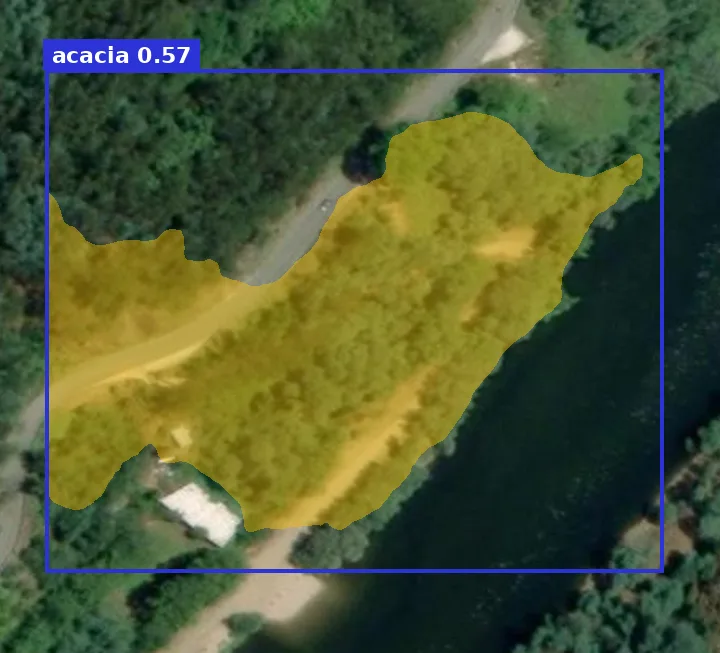
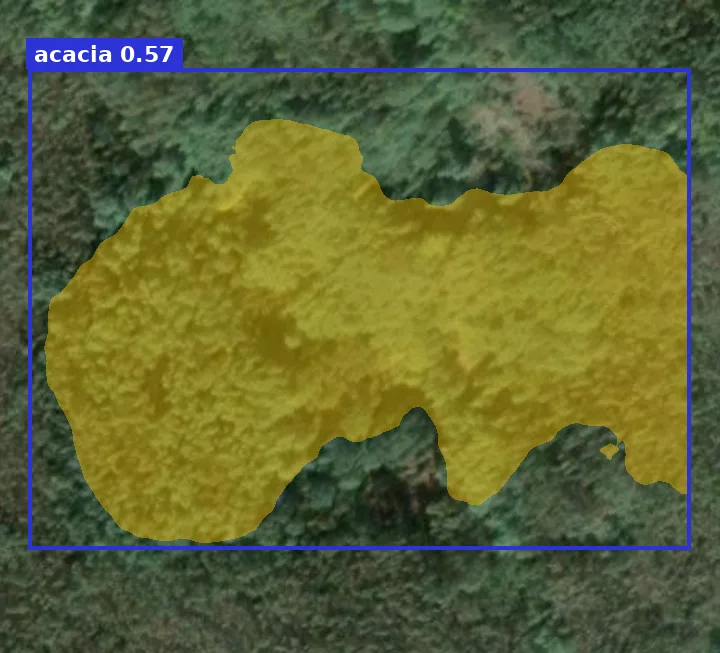
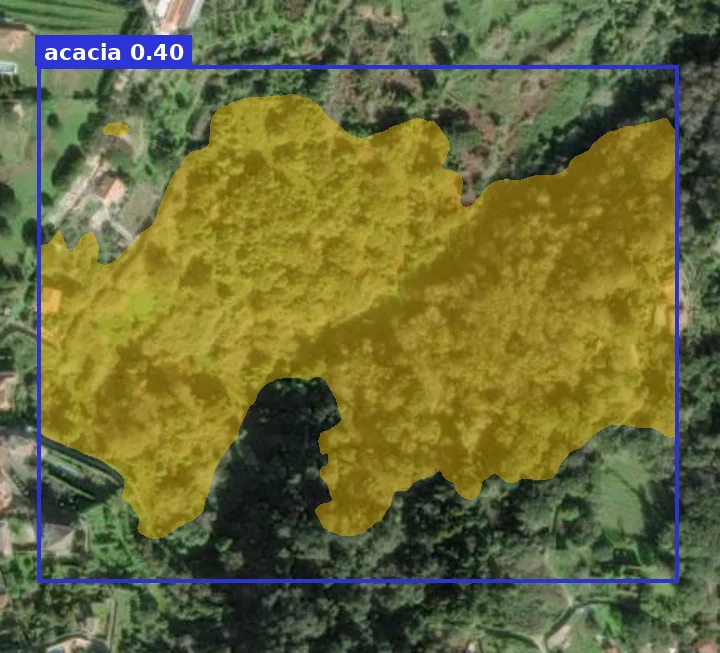
The masks copy the training labels, and those are map polygons drawn at landscape scale, not tree crowns. Boxes are much more reliable than the exact shape.
One kind of imagery
Every training tile came from the same satellite basemap at a similar zoom. Drone photos, other seasons or other resolutions are outside what it has seen, so expect it to do worse on your own images.
The problem
Acacias were brought to Portugal for timber and to hold dunes in place. They now spread through native forest faster than anyone can survey it on foot. The challenge was to find them from above, quickly and at scale, so foresters know where to act.
Building the dataset
There was no labelled dataset, so the first few hours went on building one. Portugal’s official land-use map, COS2018, marks acacia stands as their own class (5.1.1.6). We took those polygons, cut square frames around them, and pulled matching satellite imagery for each frame. We then rasterised the same polygons into 640 × 640 masks with rasterio. The same process on non-acacia land gave us negatives, so the model also learns what isn’t acacia. The masks were converted to YOLO polygon labels and published as a dataset on Hugging Face.
The model and the system around it
We fine-tuned YOLOv8n-seg, the smallest Ultralytics segmentation model, at 640 px. The nano model fit the hackathon’s time budget, and its small size is why it can run in a browser now.
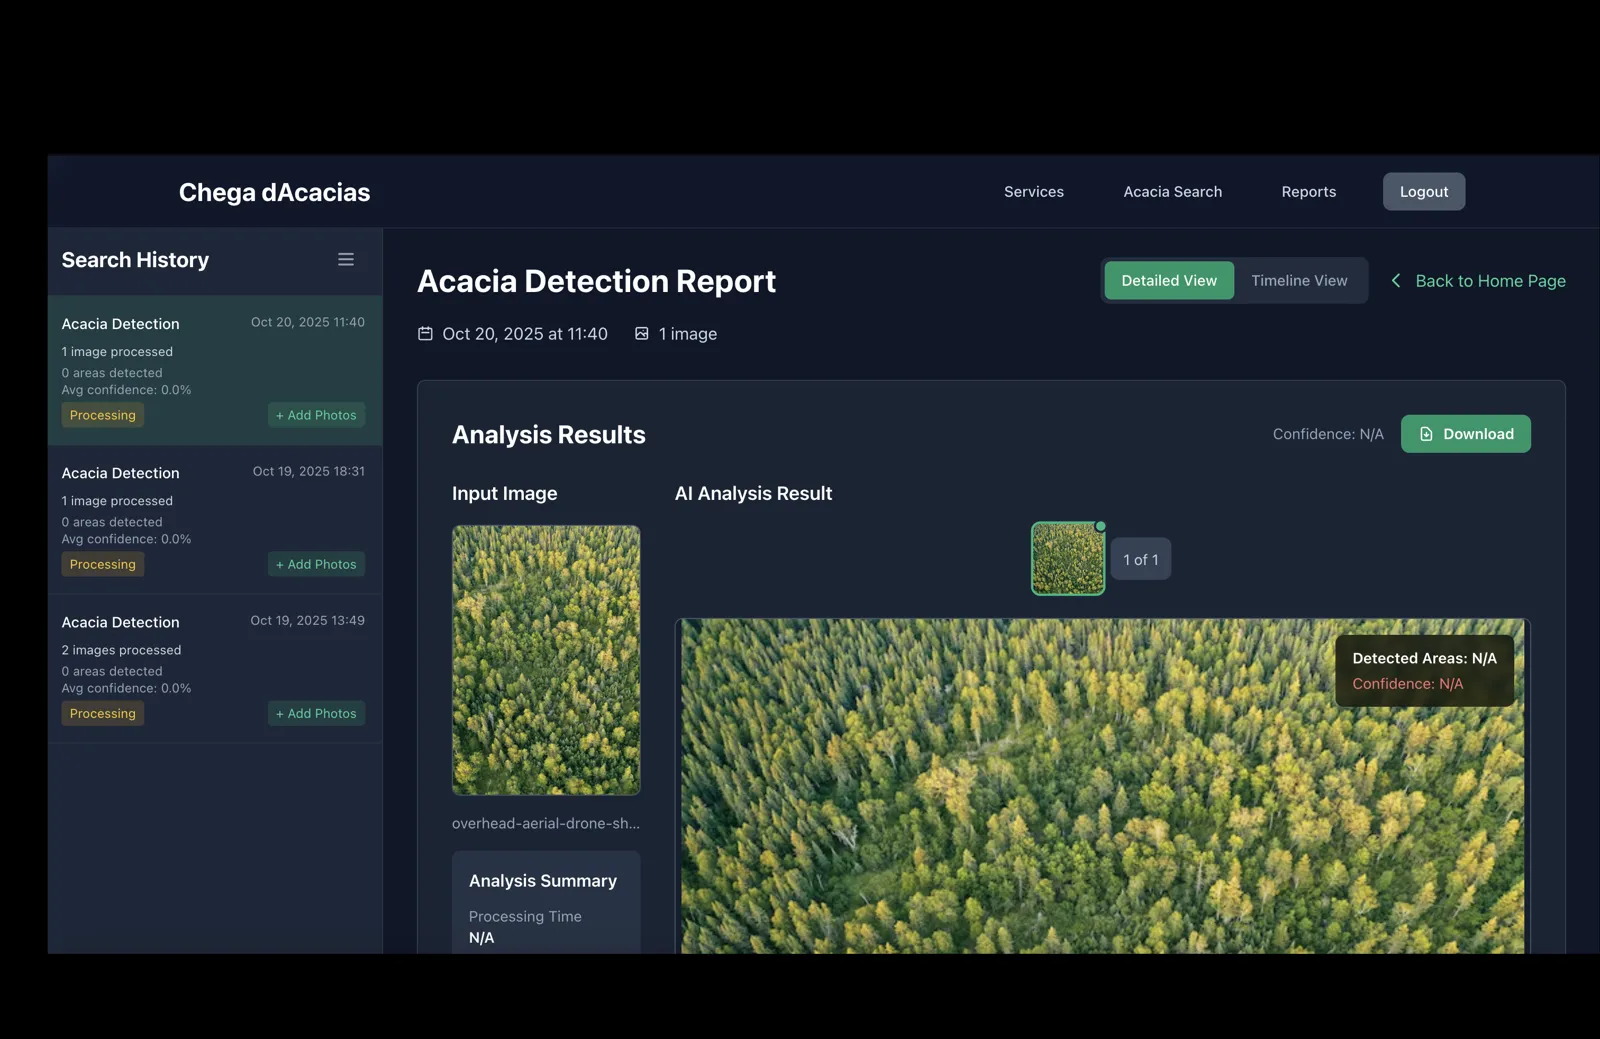
Around it we built “Chega d’Acácias”, a web app where foresters upload drone or satellite images and get back the segmented areas. Uploads go to S3. A FastAPI service queues each job on Celery with Redis, so large images never block the interface. The model is served from a Hugging Face Space, and results and history live in Firebase.
My part
I did the whole backend and the computer vision side. That covered the dataset pipeline from COS2018 polygons to YOLO labels, training the model, and the asynchronous inference service around it. My two teammates built the web app.
Results
The checkpoint in the repo was saved after 15 epochs of a planned 50. It reaches 0.56 box mAP@50 and 0.24 mask mAP@50 on the validation split. Boxes are much better than masks, and that is likely mostly a data problem: COS2018 polygons are drawn at map scale, so the “ground truth” outlines are blobs, not tree crowns. On the 48 validation tiles we have previews of, the model flags acacia in 22 of the 32 acacia tiles and in none of the 16 negatives. It is conservative rather than trigger-happy, which is the right failure mode for a tool that sends people into the field.
We came first overall at JunctionX Lisbon 2025, and first in the peer vote. We also placed second with the challenge partners’ jury and third with the organisers’ jury. The win sent us to Junction 2025 in Finland, where we built the AR meeting assistant.

About the demo
The demo runs the trained checkpoint, exported to ONNX, entirely in your browser. The tiles come from the validation split, so the model never saw them in training. Masks are computed exactly as Ultralytics computes them: 32 prototype masks combined with each detection’s coefficients, then cropped to its box. COS2018 is a map, not ground truth on the ground. Treat its outlines, and therefore the model, as a strong first pass rather than a survey.